Sigma-x Engine Visualize Intersections
utdf2gmns package provides a method to visualize intersections using the Sigma-x engine. This is an optional step and can be used to generate a visual representation of the intersections.
 1import utdf2gmns as ug
 2
 3
 4    if __name__ == "__main__":
 5
 6        path_utdf = r"datasets\data_bullhead_seg4\UTDF.csv"
 7
 8        # Step 1: Initialize the UTDF2GMNS
 9        net = ug.UTDF2GMNS(utdf_filename=path_utdf, verbose=False)
10
11        net.utdf_to_gmns_signal_ints()  # This will generate the Sigma-x engine visualization for intersections
This will save visualization file for each intersection in the current working directory. You can open these files to perform additional analysis.
Signalized Intersection Overview Chart

Phasing Chart / Table


Turning Volumes (VPH) Chart

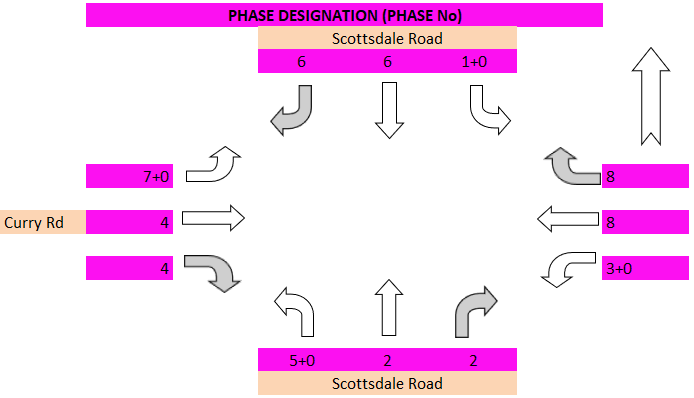
Phase Designation (Phase No) Chart
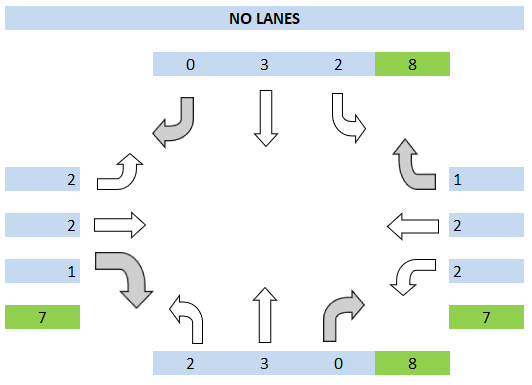
Number of Lanes Chart
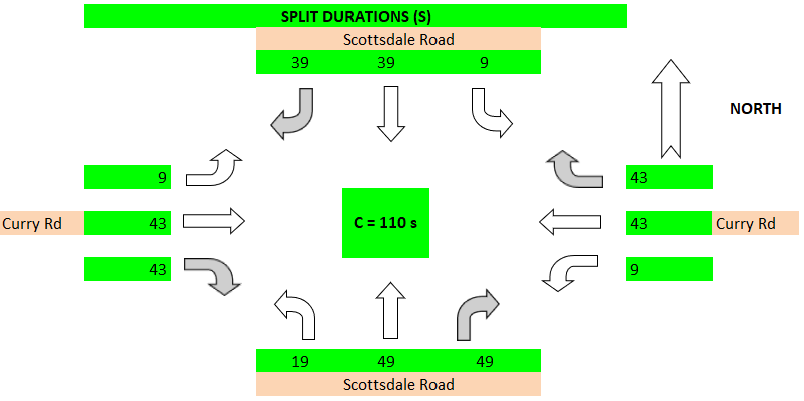
Split Durations (Seconds) Chart
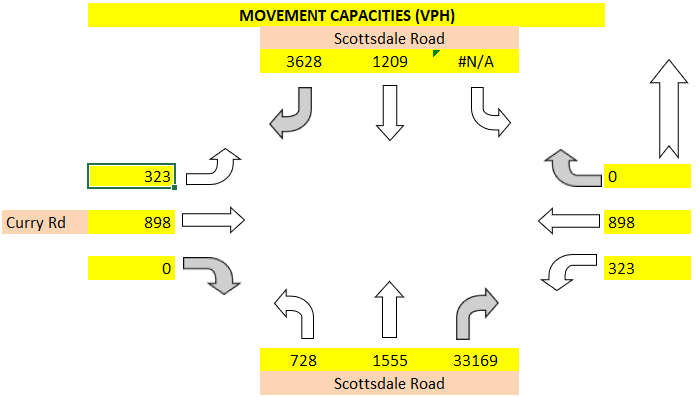
Movement Capacity (VPH) Chart
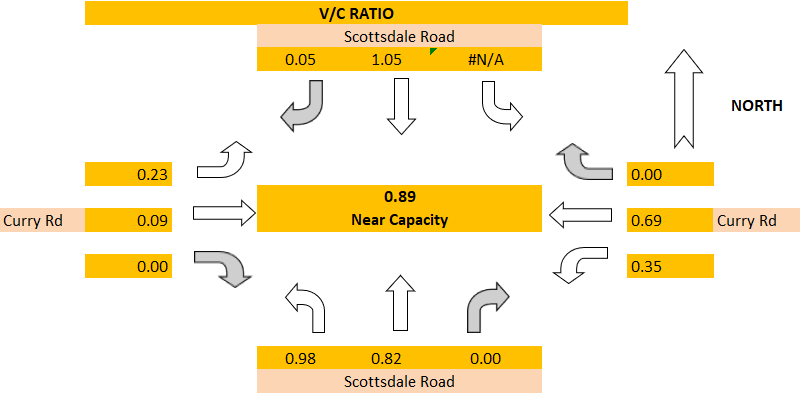
V/C Ratio Chart
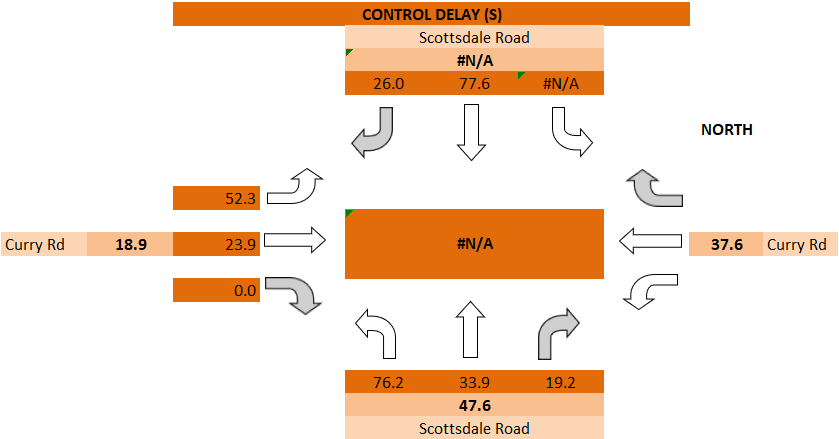
Control Delay (Seconds) Chart
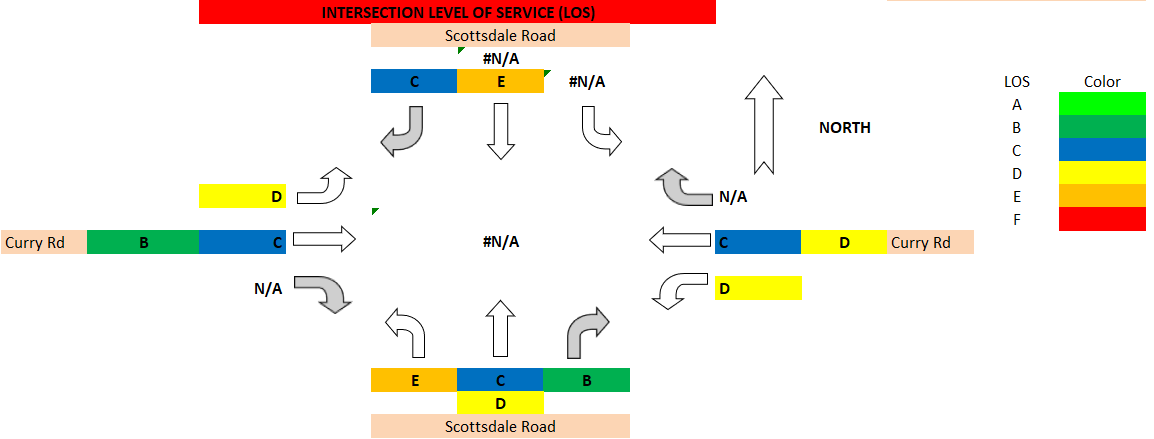
Intersection Level of Service (LOS) Chart